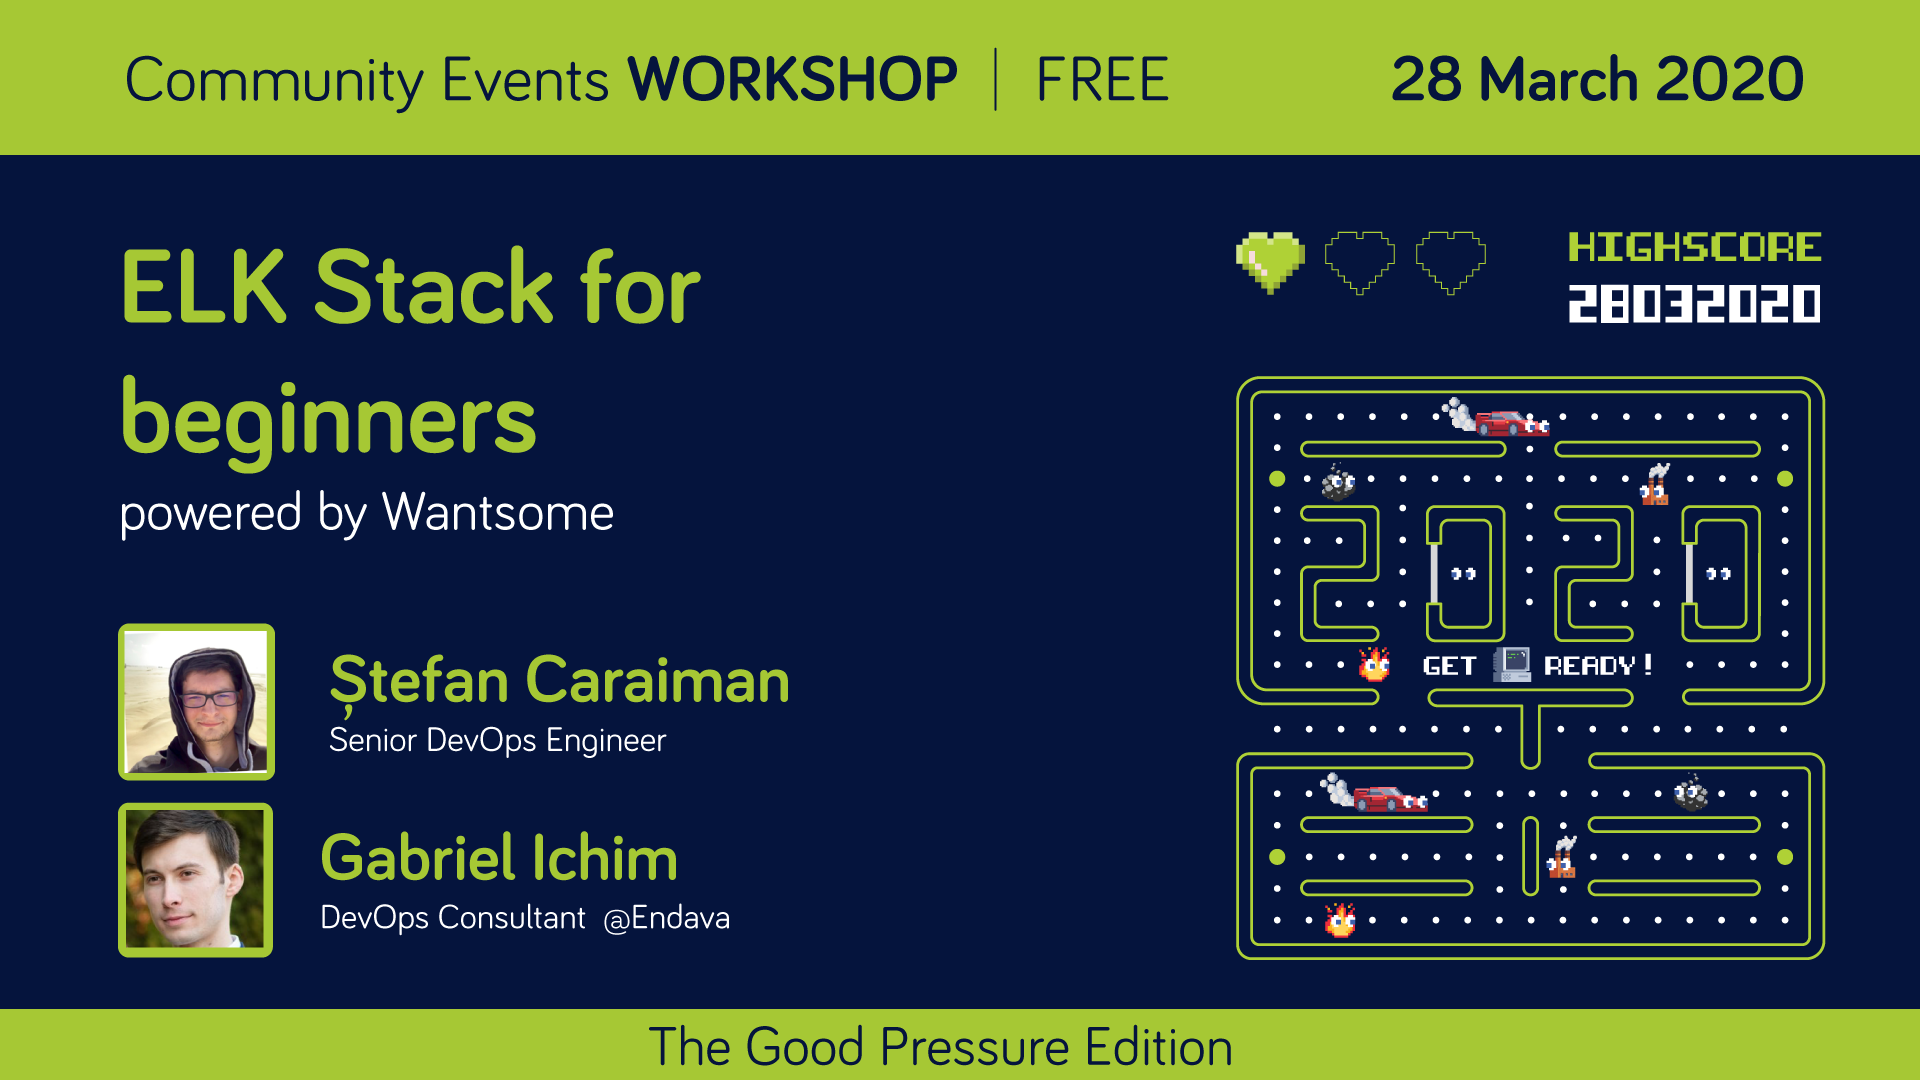
Community workshop: ELK Stack for beginners
Powered by Wantsome

Location: International Hotel, Iasi
Cost: Free
Trainers:
Stefan Caraiman - Senior DevOps Engineer
Gabriel Ichim - DevOps Consultant
Schedule: Saturday, 28 March
Welcome: 13:30 – 14:00
Workshop: 14:00 – 18:00
*Hands-On experience, you need your laptop.
About the trainers
Stefan Caraiman
Stefan started working as a Python developer on various opensource projects from the Openstack platform. He found out how easily Python can combine with the DevOps mindset and made the switch to becoming a DevOps Engineer. Besides Python, his other "sweet tooth" technologies are Continous Integration, Delivery and Deployment, Golang, Linux quirks and anything "as Code" related.
You can find more of his random thoughts on his blog at stefan-caraiman.github.io.
Gabriel Ichim
Gabriel started out as a system administrator in the web hosting industry but quickly discovered how valuable DevOps practices are in the IT world.
He has been working on building the cloud architecture for several governmental applications while automating the processes along the way. He's eager to find solutions for complex technical challenges and keeps looking for better ways to optimize the workflow of any applications.
Description
Getting information from your systems might be easy but using the data in a manner that brings value is challenging. By using the right tools to collect, parse and index your data in a central place you solve some of the puzzles. But then you need to interactively explore, visualize, share insights into your data and alert the on-call team before the end-user notices any service disruption.This workshop focuses on how to use the ELK stack (Elasticseach, Kibana, Logstash, and Beats) to build an end-to-end system for monitoring and log aggregation:
Getting useful information using Beats collectors
Parsing and transforming data on the fly with Logstash
Understanding how the Elasticseach search engine is capable of returning the best results in a matter of seconds
Level
Beginner levelObjectives
Understand the purpose and use case for each of the toolsAbility to perform basic queries in Elasticseach
Ability to build simple visualizers and dashboards in Kibana
Prerequisites
Basic Linux knowledgeBasic Git knowledge
Git installed on the local machine
OpenVPN installed on the local machine
Agenda
1. Understand the scope of each component in the ELK stack2. Run the stack (Logstash, Kibana, Elasticsearch) on the Openstack platform
3. Ingest data (logs and metrics) from different sources (Beats) into ELK
4. Filter data on ogstash
5. Perform basic queries in Elasticseach
6. Build dashboards on Kibana
7. QA session
Registration
The access is free for you! All you have to do is register here until 24 March and our team will get back to you with the confirmation. Because the workshop has a limited number of places, your seat will not be confirmed until you receive our response.Go to registration
